Covalent organic framework (COF) is a type of organic crystalline porous material1 developed in recent years, and is widely used in catalysis, separation and other fields. In terms of biomedical applications, COF has at least the following advantages2:
First, COF has regular pores with large diameters. Thanks to the long-range ordered structure of COF, the diameter of COF pores is usually greater than 20 Å. This is obviously beneficial to load larger size functional molecules, especially organic dyes with a wide range of conjugated structures (such as phthalocyanine, BODIPY, cyanine, etc.).
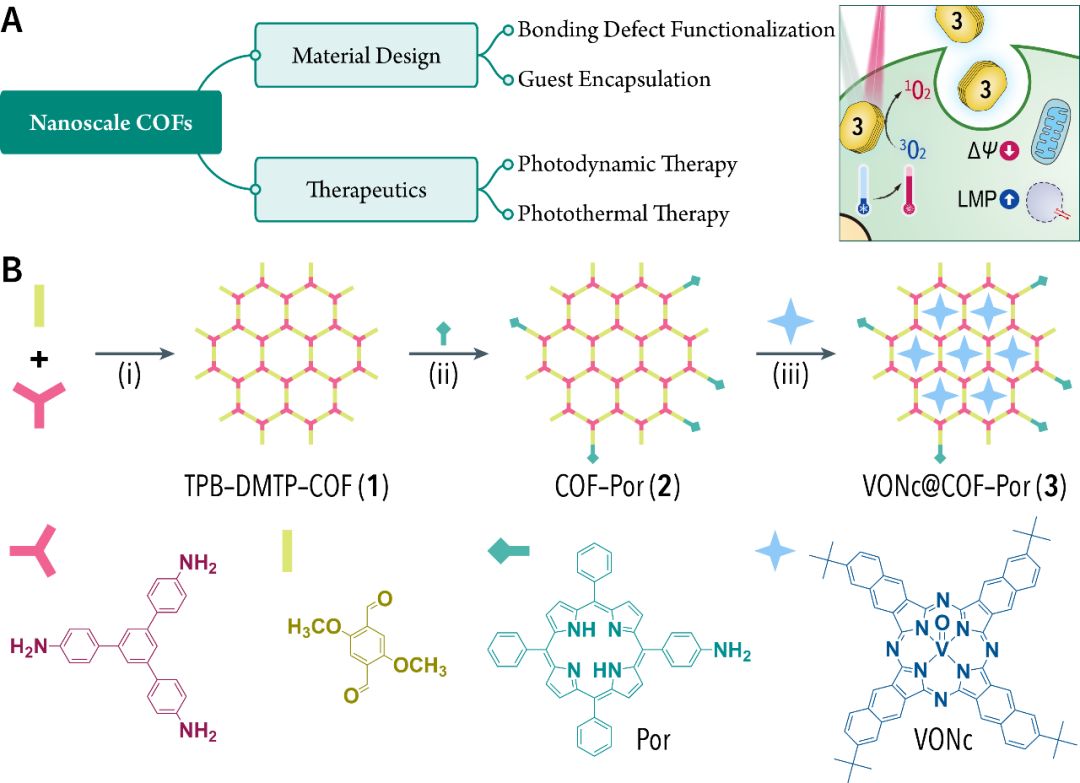
Secondly, the unreacted functional groups on the surface of COF make the surface functionalization of COF easy. From the perspective of the synthesis reaction, COF is essentially formed by the polycondensation reaction between organic monomers with active functional groups. Obviously, the active functional groups from the monomers are retained at the end (bonding defect 3). In principle, these bonding defects can be further modified to achieve surface functionalization.
Finally, most COFs do not contain metals and may have higher biocompatibility, effectively avoiding potential toxicity caused by metal-containing nanomaterials.
(A) Mind map of material design.
(B) Synthesis diagram.
The structural relationships of the components in Figures 2 and 3 are shown in Figure 2A. The structure and spectroscopic properties of the obtained nanomaterials were further confirmed by powder X-ray diffraction, Fourier transform ATR infrared spectroscopy, paramagnetic electron resonance, ultraviolet-visible absorption spectroscopy, nitrogen adsorption and desorption experiments.
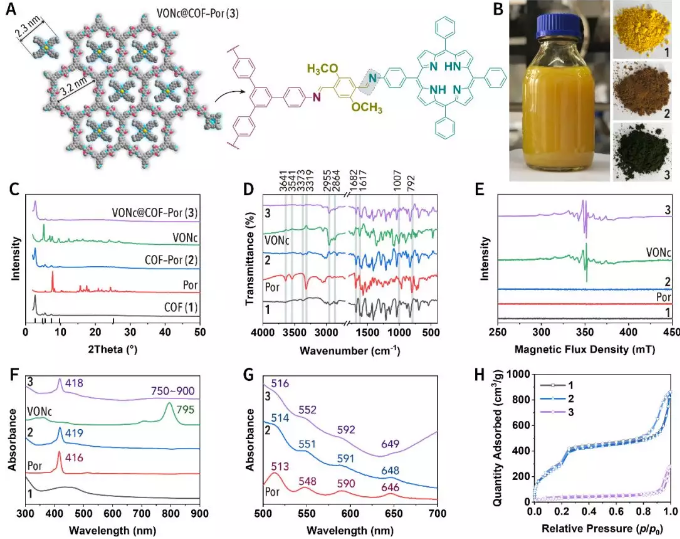
Figure 2. Material characterization.
(A) Schematic diagram of material structure.
(B) Room temperature synthesis of NCOF on a gram scale.
(C) Powder X-ray diffraction.
(D) Fourier transform ATR infrared spectrum.
(E) Electron paramagnetic resonance.
(F, G) UV-Vis absorption spectrum.
(H) Nitrogen adsorption isotherm.
The microscopic morphology and hydrodynamic properties of the material are shown in Figure 3. Nanoparticles have a uniform particle size of ~140 nm, and the higher Zeta potential implies their excellent dispersion and colloidal stability.
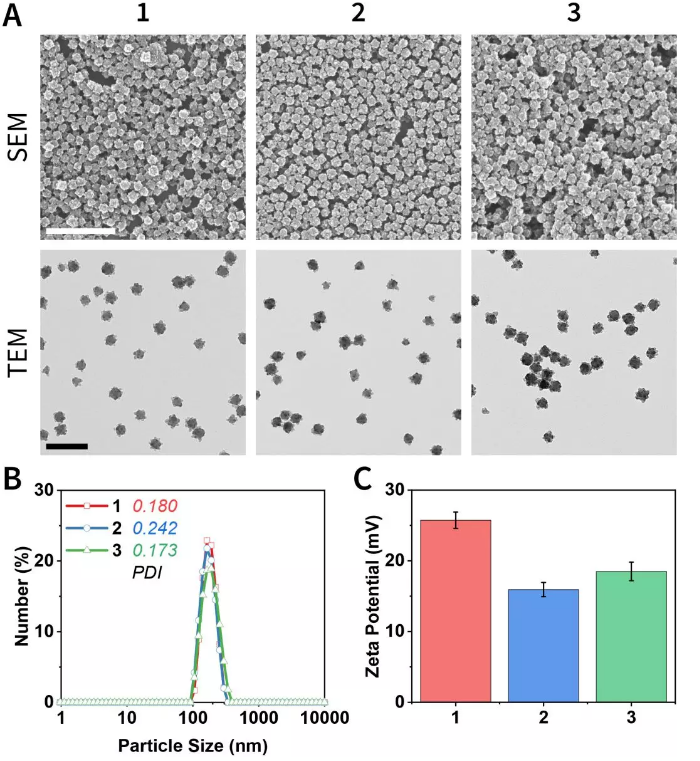
Figure 3. Microscopic morphology and hydrodynamic properties.
(A) Scanning electron microscope and transmission electron microscope photos.
(B) Dynamic light scattering and polydispersity coefficient.
(C) Zeta potential.
In a chemical environment, the photodynamic performance under red LED lamp irradiation (Figure 4), and the photothermal performance under 808 nm laser irradiation (Figure 5) were tested. The data shows that the two light sources are independently responsible for photodynamic and photothermal properties. Importantly, the photothermal conversion efficiency of 3 is as high as 55.9%, which is in a leading position in photothermal systems based on porphyrin, phthalocyanine and the like.

Figure 4 Photodynamic performance.
(A) The mechanism of inducing 1O2.
(B) DPBF probe detects the production of 1O2 induced by the red LED.
(C, D, E) UV-Vis absorption spectra of DPBF under different light sources.
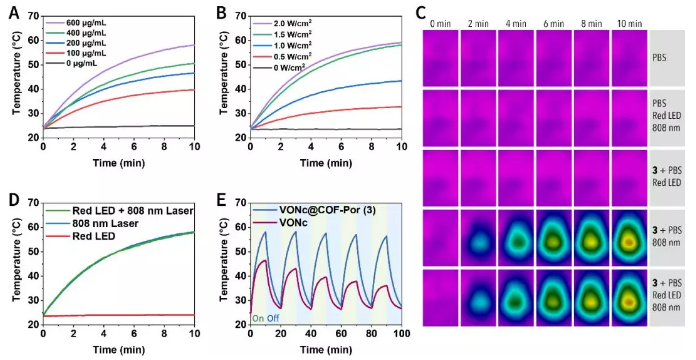
Figure 5 Light-to-heat conversion performance.
(A) Concentration dependence of photothermal properties.
(B) Optical power density dependence of photothermal properties.
(C) Thermal imaging of the dispersion when illuminated by different light sources.
(D) The temperature of the dispersion changes when illuminated by different light sources.
(E) Verify the photothermal stability of the material through the On-Off cycle experiment.
Red LED-induced photodynamic therapy and 808 nm laser-induced photothermal therapy were evaluated by cell-level MTT experiment, calcein-AM/propidium iodide staining experiment, and cell scratch experiment, confirming the superiority of the combination therapy (Figure 6 ). Further experimental results show that the obtained nanomaterials have different degrees of damage to mitochondria and lysosomes (Figure 7).

Figure 6. Anti-tumor activity in vitro.
(A) Cell viability determination.
(B) IC50 of different treatment methods.
(C) Verify the combination of different therapies through inhibitors.
(D) Calcein-AM/propidium iodide staining experiment.
(E) Cell scratch test.
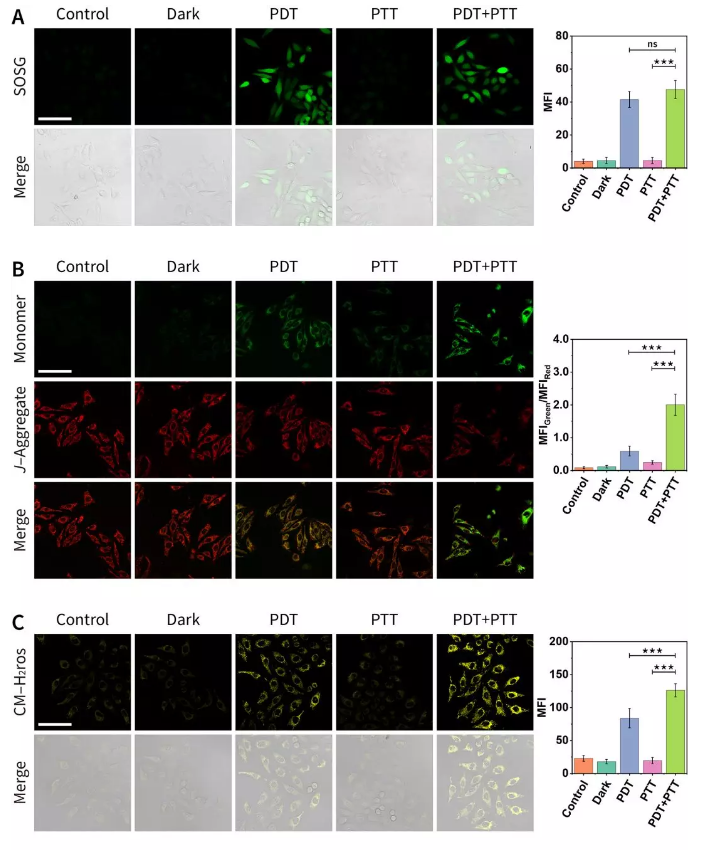

Figure 7. Confocal laser imaging to study anti-tumor mechanism.
(A) Use SOSG fluorescent probe to detect 1O2 in cells.
(B) Using JC-1 fluorescent probe to evaluate cell mitochondrial membrane potential.
(C) Evaluation of mitochondrial oxidative stress using CM-H2ros fluorescent probe.
(D) Use AO fluorescent probe to assess the integrity of lysosomal membrane.
Finally, the anti-tumor properties of the obtained materials were also evaluated in animal experiments (Figure 8). The combined treatment almost completely cured the tumor-bearing nude mice without irreversible skin damage.
Figure 8. Animal experiments on xenograft models.
(A) Animal experimental treatment plan.
(B) Tumor photo after treatment.
(C) Tumor volume curve.
(D) Tumor quality after treatment.
(E) Animal body weight during treatment.
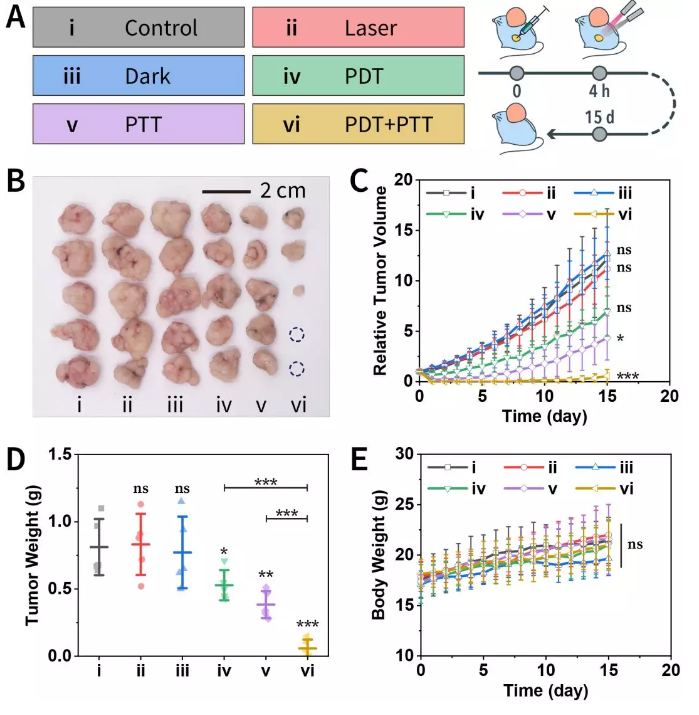
Figure 8. Animal experiments on xenograft models.
(A) Animal experimental treatment plan.
(B) Tumor photo after treatment.
(C) Tumor volume curve.
(D) Tumor quality after treatment.
(E) Animal body weight during treatment.