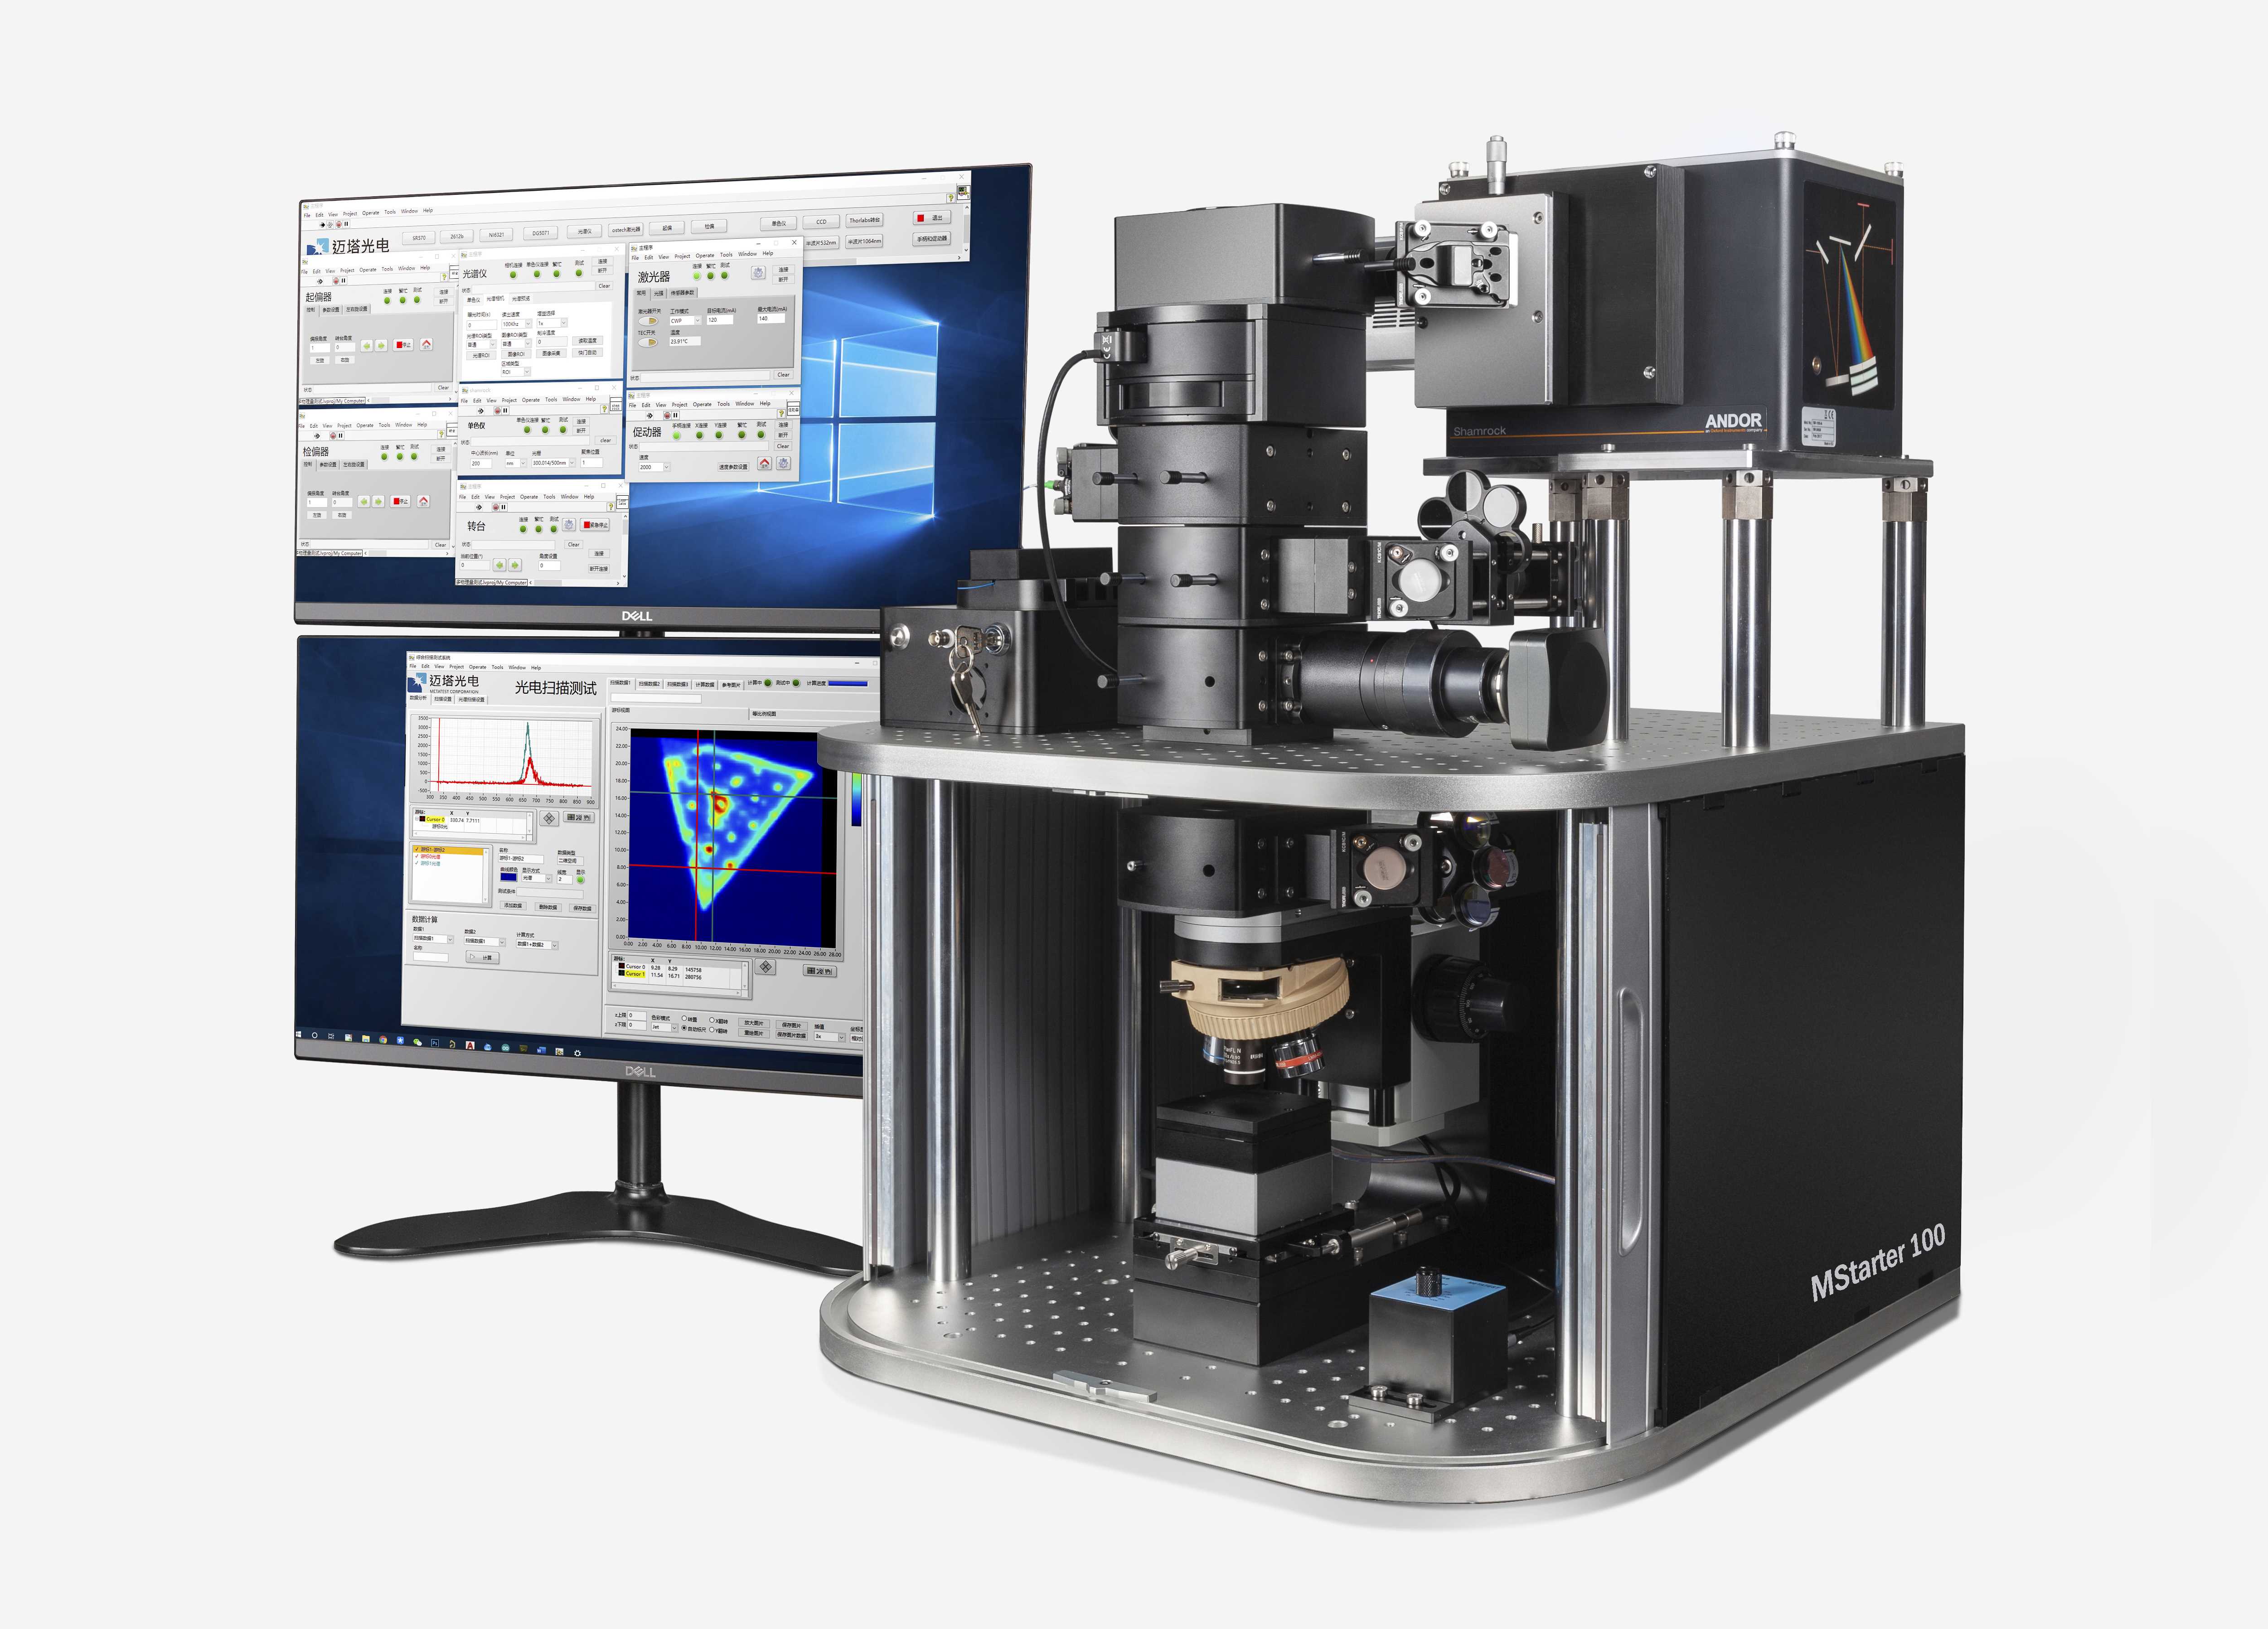
The MStarter 100 microspectral scanning test system combines a stable microscopy optical path with a patented high-speed, high-resolution scanning technique that is ideal for microspectral analysis of materials such as 2D materials, quantum dots, and perovskites. The MStarter 100 consists of two lasers, 405 nm and 532 nm, for fluorescence and Raman spectroscopy. The MStarter100 has a high spectral collection efficiency due to the use of free light paths to collect scattered light from the sample. Thanks to the stable microscope mechanical design, it is also possible to use long-term tests to measure samples with very weak signals. Numerous optional modules support different applications, including polarization Raman/fluorescence spectroscopy, fluorescence lifetime testing, and absorption spectroscopy.
The main technical parameters*
Magnification 4 times, 10 times, 20 times, 50 times, 100 times 5 objective lenses
Laser wavelength 405nm, 532nm
Spectrometer configuration 193mm focal length, deep cooling front-illuminated CCD, cooling temperature -60 degrees
Raman spectroscopy test range 180-4000 wave number (optional 90-4000 wave number)
Fluorescence spectrum test range 430-1000nm (405nm excitation), 540-1000nm (532nm excitation)
Scan range 200um in the XY direction
Scanning point spacing minimum 50nm
Spatial resolution 400nm
Optional function ** Polarized Raman spectroscopy test module, polarized fluorescence spectroscopy test module, electronic multiplying CCD upgrade, fluorescence lifetime test module, 488nm, 632nm, 785nm laser source module, absorption spectroscopy test module
* Please download the MStarter 100 configuration list for detailed configuration.
** The total number of optional function modules is no more than 2 (excluding polarization dependent test modules)
MStarter 100 light path design
High stability microscope structure

MStarter 100 features a high-stability microscope frame design for long-term stability testing

The MStarter 100 features a high-stability microscope stand for long-term stability testing. The sample was observed using a 100x objective lens and there was no visible change for more than 3 hours.
Multicolor filter assisted focus design
Five color filters change the color of the illumination so that lasers of different wavelengths can be accurately focused on the sample surface.

If a white illumination source is used and the 405 nm laser is adjusted to the minimum spot size, since the imaging path has chromatic aberration, the actual laser is not focused on the sample surface, and the PL mapping scan is poor, as shown in Figure b. However, if a purple illumination source is used to adjust the 405 nm laser focus, since the illumination source and the laser wavelength are similar, the chromatic aberration of the imaging system can be compensated, so that the laser is accurately focused on the sample surface, and a high-resolution PL mapping scan image is obtained, as shown in FIG.

The MStarter 100 uses a stacked optical path in its design, which is structurally stable and extensible. Adding a module only requires lifting height, which is very convenient.

The MStarter 100 is equipped with a closed enclosure that completely shields against ambient light interference. The cover adopts the front opening design, the guide rail is directly processed on the mechanical structure, and the switch cover does not affect the optical path stability of the microscope.
High resolution Raman/fluorescence spectrum mapping
The MStarter 100 uses a free-space optical path design, and the Raman/fluorescent signal of the sample is directly focused on the spectrometer slit through the mirror, providing high collection efficiency. The spectrometer uses a cold-type detector with extremely low thermal noise for long-term integration, which combines to ensure the accuracy of weak spectral testing. Using a high-precision piezoelectric stage, the Mstarter100 can scan up to 20 nm in the range of up to 200 μm. Since the spot size is around 500 nm (532 nm laser), the spatial resolution of the spectral scan is also 500 nm. The Mstarter 100 Spectral Test Software features fast processing of spectral mapping data, automatic smoothing, automatic calculation of integration, mean, peak position, peak width and more.

MoSe2 sample Raman spectroscopy test, (a) bright field photo and sample Raman spectrum photo, (b) Raman scan line graph, showing the scanning resolution of 400 nm (c) Raman spectrum Mapping picture, each point Represents the intensity of the Raman spectrum. (d) Raman spectral mapping picture, each point representing the position of the Raman peak. The 532 nm laser is used in the test. The MoSe2 Raman scan range is 13*13 um, the integration time is 0.01 s, and the dot pitch is 150 nm. The scan time is 262 s.

Fluorescence spectroscopy of MoSe2 samples, (a) sample fluorescence spectra and brightfield photographs, (b) fluorescence spectrum scan images, each point represents fluorescence intensity, (c) fluorescence spectrum mapping, each point represents spectral peak position, (d) The fluorescence spectrum is a mapping picture, and each point represents the full width at half maximum of the spectrum. The 405 nm laser was used in the test. The MoSe2 Raman scan range is 18*19 um, the integration time is 0.05 s, the dot pitch is 0.15 um, and the scan time is 500 s.
Fluorescence lifetime spectroscopy and mapping
The MStarter 100 can be equipped with a fluorescence lifetime test function. The instrument channel width is 64 ps, which is suitable for samples with perovskite, quantum dots and other fluorescence lifetimes exceeding 500 ps. The detector is mounted on the spectrometer and can scan the spectrum by rotating the grating to obtain a life curve of the sample at different wavelengths.

With the high-resolution sample scanning test system, fluorescence lifetime mapping can also be performed. The data processing software can automatically process the mapping data, fit with up to 3 indices, and directly generate a Mapping image with different parameters.

Fluorescence lifetime scan test (a) bright field picture, red frame for scan area (b) fluorescence lifetime scan intensity map, (c) fluorescence lifetime scan average life map, (d) fluorescence lifetime scan fit τ1 lifetime map, (c) Fluorescence lifetime scan fit τ2 lifetime map
source:https://www.metatest.cn
|
Warm tip: the products supplied by Beijing Beike Xincai Technology Co., Ltd. are only used for scientific research, not for human body |