已传文件:photo/1794275778.png
This study was published in Advanced Functional Materials under the title “Lipid Droplet-Powered Microneedles Orchestrate Tumor Microenvironment Remodeling to Enhance Immune Activation in Melanoma”.
Melanoma progression is sustained by profound metabolic reprogramming and immunosuppression within the tumor microenvironment, wherein adipocyte-derived lipid droplets (LDs) act as critical metabolic regulators. Herein, we harness this intrinsic biological feature by engineering resveratrol-loaded lipid droplets (RSV-LDs) as natural lipophilic nanocarriers to mediate intracellular delivery and immunometabolic reprogramming. For precise, localized administration, RSV-LDs are incorporated into dissolvable microneedles to achieve efficient transdermal delivery while minimizing systemic exposure. This strategy markedly elevates the M1/M2 macrophage ratio and promotes robust CD8⁺ T-cell infiltration, thereby remodeling the immunosuppressive tumor microenvironment. To further potentiate the activity of these infiltrating CD8⁺ T cells, we integrate ROS-responsive anti-PD1 nanoparticles (aPD1-NPs) via thioacetal linkages, enabling tumor-specific antibody release within the oxidative tumor microenvironment. Notably, transcriptomic and single-cell analyses reveal that innate immune and metabolic pathways are synergistically activated after treatment, and TLR7/8-expressing monocytes serve as central communication hubs among T-cell, NK-cell and B-cell populations. Collectively, these findings demonstrate that the microneedle-based RSV-LD/aPD1 platform can trigger local metabolic and immune reprogramming to remodel the tumor microenvironment and amplify antitumor immunity.
Literature Highlights
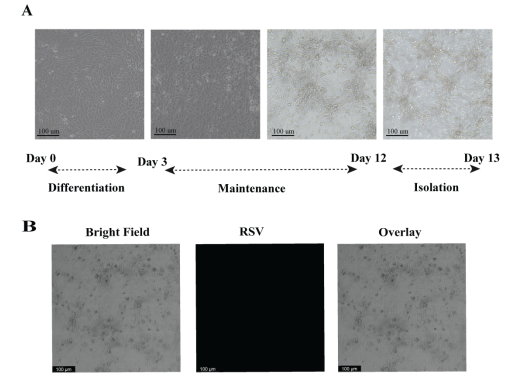
Figure 1.
Development and optimization of RSV-loaded lipid droplets (LDs). (A) Representative image showing the formation of lipid droplets (LDs) in adipocytes. (B) Confocal microscopy image showing no detectable RSV signal inside lipid droplets after incubation with 150 µM RSV for 8 days. Scale bar = 100 µm.
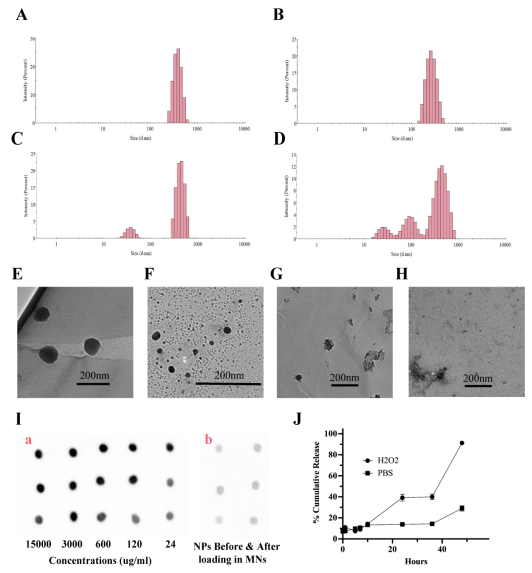
Figure 2.
Characterization of the ROS-responsive behavior, antibody integrity and release profiles of aPD1 nanoparticles. Dynamic light scattering (DLS) analysis of aPD1 nanoparticles incubated for 24 h at room temperature under different conditions, including PBS (A), Cu(NO₃)₂ (50 µM) (B), H₂O₂ (500 µM) (C), and Cu(NO₃)₂ + H₂O₂ (D), revealed progressive changes in particle size and distribution under oxidative conditions. Transmission electron microscopy (TEM) images (E–H) showed that nanoparticles retained a spherical morphology in PBS, exhibited partial structural deformation upon H₂O₂ treatment, and displayed substantial structural disruption and aggregation in the combined Cu²⁺ + H₂O₂ group, supporting ROS-triggered destabilization of the thioacetal crosslinked nanoparticle network. Dot blot analysis (I) of free aPD1 at varying concentrations (a) and aPD1 nanoparticles before and after microneedle (MN) loading (b) confirmed efficient antibody loading and preserved antigen-binding activity following nanoparticle fabrication and MN integration. In addition, ELISA-based release studies (J) demonstrated minimal aPD1 release under physiological conditions (PBS), whereas markedly accelerated release was observed under oxidative conditions (H₂O₂, 500 µM, room temperature), verifying the ROS-responsive antibody release behavior of aPD1 nanoparticles.
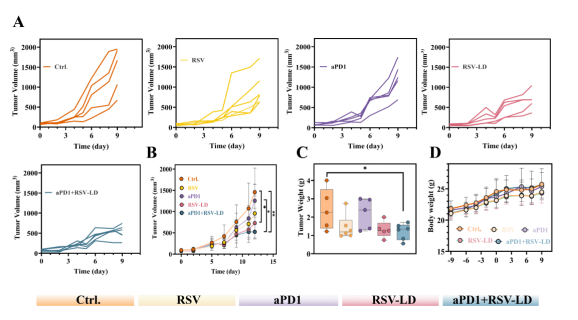
Figure 3.
Tumor growth inhibition and body weight monitoring following MN-based therapy. (A) Individual tumor volumes. (B) Time-dependent changes in tumor volume across different treatment groups. (C) Tumor weights at the study endpoint. (D) Body weight monitoring during the experiment. Statistical significance was determined by one-way analysis of variance (ANOVA), followed by Dunnett’s or Tukey’s multiple comparisons test as appropriate.
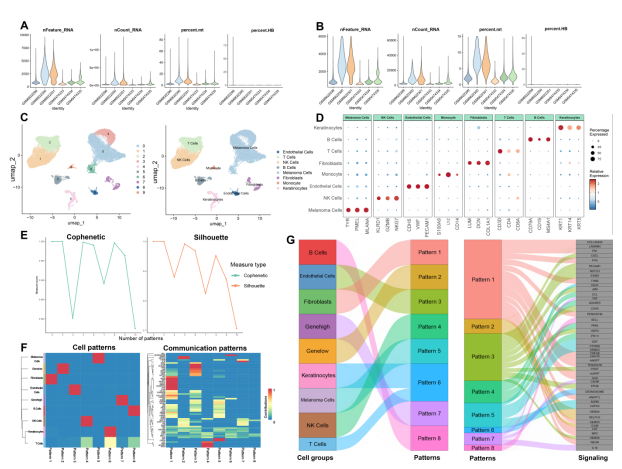
Figure 4.
Quality control, clustering and communication pattern analysis of single-cell RNA-seq data. (A) Violin plots of nFeature_RNA, nCount_RNA and percent.mt for each sample before quality control. (B) Violin plots of nFeature_RNA, nCount_RNA and percent.mt for each sample after quality control. (C) UMAP visualization of cell clusters annotated by cell type. (D) Dot plot showing the expression of canonical marker genes in major cell populations. (E) Adjacency coefficient and silhouette coefficient for different numbers of communication patterns to determine the optimal clustering. (F) Heatmap showing the distribution of cell-type contributions across eight identified cellular and communication patterns. (G) Sankey diagram illustrating the secretory cell communication pattern.
Reference Information
Advanced Functional Materials (IF: 19.9)
Pub Date: 19 June 2026
DOI: 10.1002/adfm.76567
We specialize in custom nano-medical functional materials. We conduct targeted development to tailor structure, particle size and surface modification for your experiments. Full characterization, iterative optimization and technical support are available for targeted delivery, bioimaging and nanomedicine studies. Send your evaluation plans to us.
Engineer Zhang: 17715390137
Engineer Chen: 18914047343